Description
Measure, understand, correct
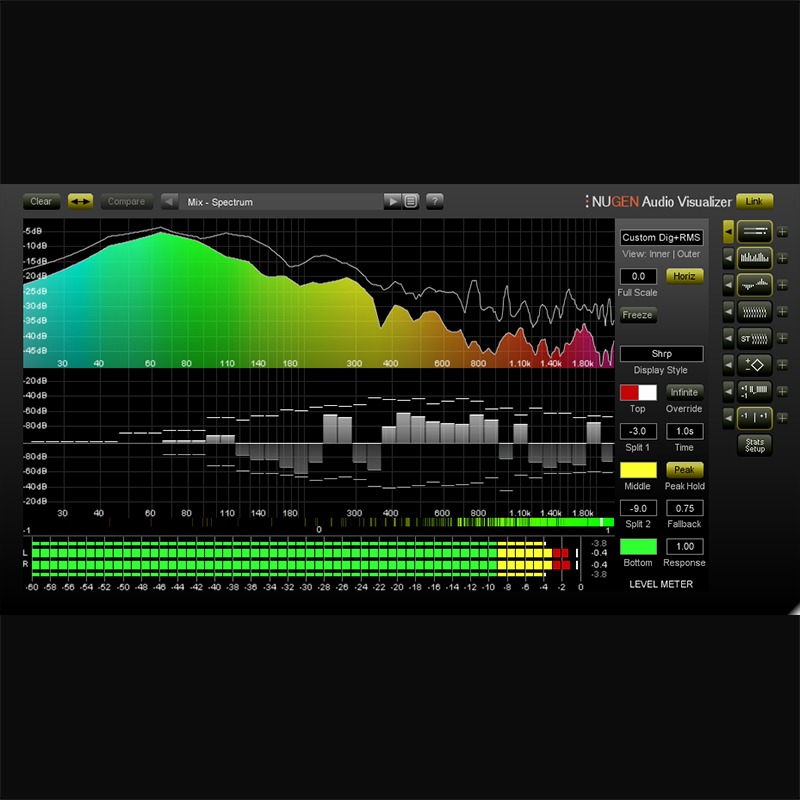
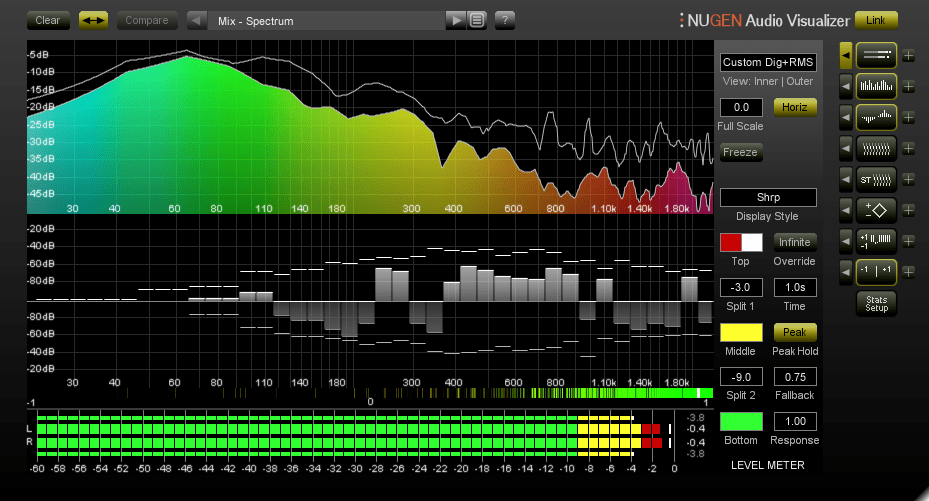
Visualizer gives you an indispensable set of audio analysis tools for quality audio production, with a standardised reference set of professional views which allow you to work faster, avoid mistakes and repeat past success.
A fully resizable, flexible interface presents all the information you need in a single plug-in window, saving time and reducing plug-in juggling complexity.
All views are highly customisable, each with an individual settings panel. Visual solo controls allow for instant inspection of any view from the click of a single button.
Customised analysis
Powerful, flexible audio analysis, giving you immediate access to precisely the information you need, when you need it.
- Resizable interface
- Intelligent window optimization
- Stand-alone and plug-in versions
- Stereo spectrogram
- Vectorscope
- Stereo bias meter
- Peak hold control
- Correlation by frequency
- FFT spectrum analysis
- Frequency/dB zoom & scroll
Single intelligent window system
Visualizer’s unique intelligent window facility lets you select multiple view combinations, automatically resizing and aligning windows to maximise legibility and cross referencing information across screens. No need to switch between plugins to get the combination of views you want. User configurable presets let you switch instantly between setups and interface sizes to build the workflow that suits you.
Comparative analysis
Comparison mode allows the direct comparison of two sources within a single Visualizer interface, utilising overlay, side-by-side and differential views. Ideal for examining the difference before and after a mastering signal chain or for comparing spectra in preparation for EQ matching or notching out.
For music production
Visualizer’s intuitive display can be used for setting input levels, checking the phase relationship of your audio sources, and understanding the acoustics of a studio space, either by identifying problem frequencies or alerting you to unwanted noise in your signal path.
Use Visualizer to see and identify fundamental, characteristic or hidden frequencies in a recording, in order for you to EQ or even completely notch out problem frequencies. Detailed analysis of stereo placement, which can be particularly important for centering lead vocals, and for low end control.
Visualizer can be used for visual A/Bing of stereo spread and sonic fingerprinting, as well as checking phase relationships. Monitor your low frequencies and headroom, as well as examining dynamics and ensuring your project meets broadcast standards.
For post and broadcast
Clear and accurate phase analysis including overall Correlation, Correlation History, Vectorscope and Correlation by Frequency gives a highly accurate picture of your audio, allowing you to avoid potential cancellation problems and phase issues. Visualizer allows you to deliver robust, compliant audio with confidence.
Stereo and low frequency analysis ensures audio is suitable for TV broadcast by allowing you to easily monitor energy distribution and image stability.
Multiple frequency analysis views and comparison modes enable simple monitoring of stems to avoid masking dialog clarity issues.
Hybrid operation
Visualizer is also available with an optional HDX extension which enables support for Avid AAX DSP Hybrid operation.
Typical applications
- Mic-ing up and setting levels
- Detailed analysis of the stereo field
- Checking for phase cancellation
- Identifying fundamental frequencies
- Zoning in on problem frequencies
- Examining phase relationships
- Analysing dynamics